Blog - The latest articles and news
Stay up-to-date with the latest industry news as our marketing teams finds new ways to re-purpose old CSS tricks articles.
Stay up-to-date with the latest industry news as our marketing teams finds new ways to re-purpose old CSS tricks articles.
by Kingdom Kode Team, Digital Innovation

You feel it every month. Money is slipping out somewhere, but you can't point to it. When someone asks "how much revenue is my business losing?" your honest answer is a shrug and a bad feeling in your gut.
That feeling is expensive. And it's fixable. But you can't fix a number you've never calculated.
So let's calculate it. Grab your booking software, your phone log, and 30 minutes. We're going to turn your vague dread into a real dollar figure — one line item at a time.
Each leak below comes with a plug-in formula. Fill in your own numbers. Add them up at the bottom. The total tends to be bigger than the gut estimate.
Every service business bleeds in the same predictable spots. Here's how to measure each one.
Every call you don't answer is a customer who calls the next guy.
Formula: missed calls/month × close rate × average ticket
A barbershop misses 40 calls a month. Half would've booked (50% close rate). Average cut is $35.
40 × 0.50 × $35 = $700/month gone.
Check your phone's missed call log for the last 30 days. The number is usually higher than owners guess, because voicemail hang-ups don't feel like lost customers — but they are.
A no-show is a slot you could've sold twice — once to the ghost, once to a real customer.
Formula: no-shows/month × average ticket
A clinic with 25 no-shows a month at a $120 visit is leaking $3,000/month — before you count the staff time paid to stand around.
If you don't take deposits or send confirmation reminders, this number is bigger than you think.
Tuesday afternoon is dead. That's not "just how it is" — that's inventory you're throwing away. A chair empty at 2pm is revenue you can never get back.
Formula: empty slots/week × 4 × average ticket × a conservative fill rate (say 30%)
A salon with 15 empty midweek slots, $60 average ticket, filling just 30% with a slow-day offer:
15 × 4 × $60 × 0.30 = $1,080/month you're leaving on the floor.
Here's the quiet killer. A customer comes in, loves it, walks out — and you never proactively pull them back. They "mean to" return in 4 weeks. They return in 9. Or never.
Formula: (ideal visits/year − actual visits/year) × customers × average ticket
If 200 clients each visit 2 fewer times a year than they should at $40 a visit:
200 × 2 × $40 = $16,000/year = ~$1,333/month.
This one compounds. Every month without rebooking widens the gap.
If you don't show up in the map pack when someone searches "barber near me," you don't exist for that customer. They're not comparing you and choosing someone else. They never saw you.
Formula: estimated monthly "near me" searches you're missing × 5% capture × close rate × average ticket
Even a modest estimate — 300 local searches, capturing 5%, 60% close, $50 ticket:
300 × 0.05 × 0.60 × $50 = $450/month in searches you're invisible for.
Search your own service + "near me" on your phone. If you're not in the top 3, you're paying for it.
Two shops, same service. One has 12 reviews. One has 180. Who gets the call? Fewer reviews means a lower conversion rate on the traffic you already have — you're paying full price for attention and closing less of it.
Formula: monthly leads × conversion lost to weak reviews (5–15%) × average ticket
100 leads a month, losing a conservative 10% to a thin review profile, $50 ticket:
100 × 0.10 × $50 = $500/month in trust you never built.
Speed is a close rate. When a lead sits for hours, there's a good chance they've already booked with whoever answered first. If form fills and DMs pile up in an inbox you check at night, some of them are already gone.
Formula: monthly online leads × conversion lost to slow response (10–30%) × average ticket
50 web leads, losing 20% to slow follow-up, $80 ticket:
50 × 0.20 × $80 = $800/month cooling off in your inbox.
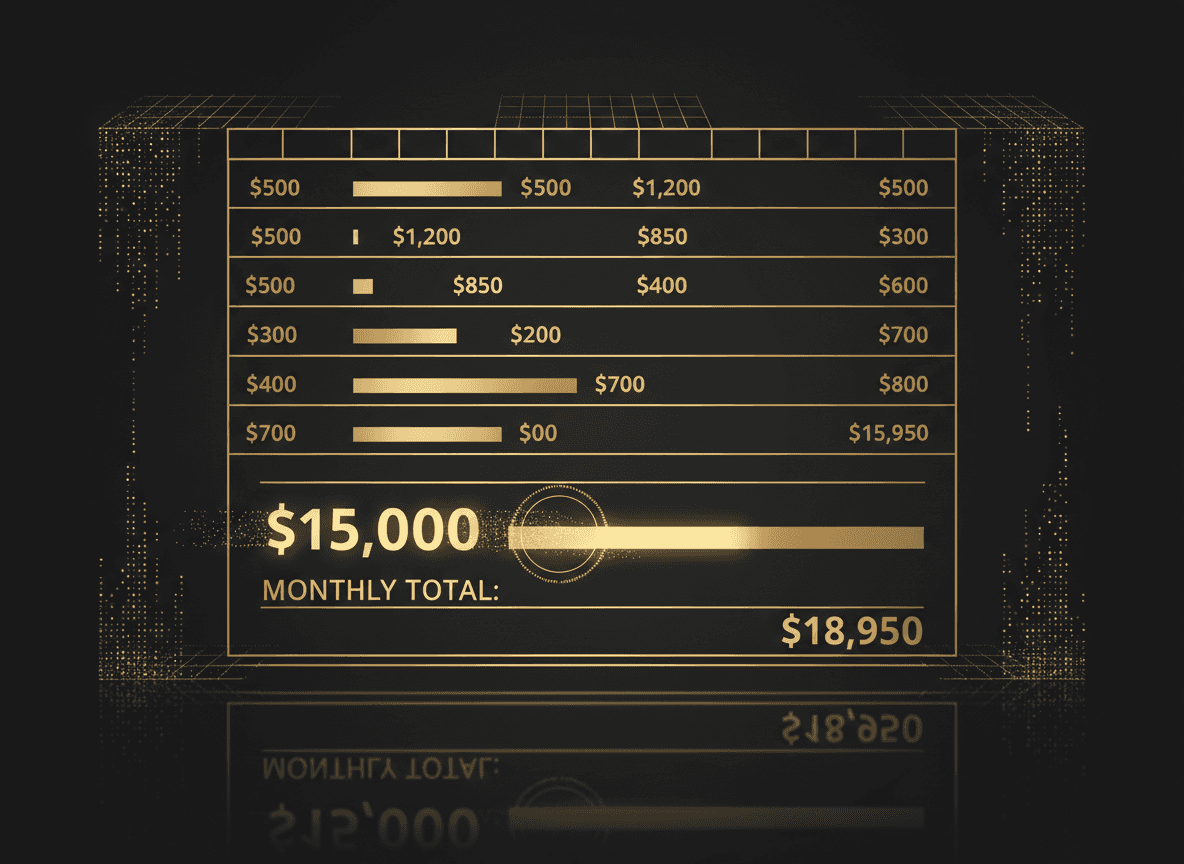
Stack the line items from our example business:

Total: ~$7,863/month. Nearly $94,000 a year.
That's not a hypothetical fortune. That's demand you already generated and then dropped on the floor. The customers already wanted you. The systems just weren't there to catch them.
And here's the kicker: closing even half of that costs a fraction of what you're losing. This isn't a growth problem. It's a plumbing problem.
You can do this teardown by hand — and you should at least once, because seeing your own numbers changes how you run the place.

But it takes an afternoon of digging through call logs and booking data, and the by-hand version misses things a machine catches instantly.
That's exactly what we built the Revenue Code Diagnostic to do. It scans all 7 leak points, plugs in your real numbers, and hands you the monthly dollar total in minutes — no spreadsheet, no guessing.
Run your free Revenue Code Diagnostic and get your leak number today. Then you'll know exactly which line item to plug first.
Want more teardowns like this? Read the blog or get in touch if you want a human to walk your numbers with you.
Most SaaS founders treat the free trial as a waiting room. The ones converting at 25% or higher treat it as a structured sales system. Here is how to build that system.
Read moreA product roadmap tells you what you are building. A revenue engine tells you whether it is making money. Most SaaS founders only have one of these, and it is the wrong one.
Read more